

At NES Health, our goal goes beyond helping our practitioners get better and faster results for their clients with a system that's easy to use. We want to produce research that helps the world understand the power and potential of bioenergetic health solutions. The following is an early example of how we can use our cloud-based system to understand the impact of our products.
We implemented short, self-reporting questionnaires into our cloud system to gather data on symptoms associated with energy/fatigue, pain, sleep, and stress/anxiety. We identified pre/post-visit effects on Wellness Scores (WS) and Symptom Severity (SS). This study included ~6,000 participants with 2 visits or more; ~3000 participants with 3 visits or more; and ~1800 participants with 4 visits or more.
When we looked at everyone together – including those who already felt well – meaningful change was difficult to see. This is because those who already feel well are not likely to see change.
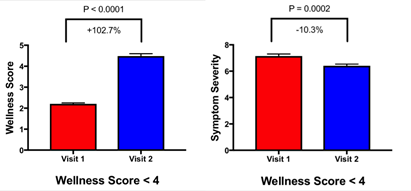
But when we looked at those who reported low Wellness Scores (WS) in their initial visits, results became much clearer. For the 264 participants with 2 or more visits who had a WS < 4 at their first visit, the mean WS was 2.21 at Visit 1 and 4.48 at Visit 2, a 102.7% increase; and mean SS was 7.15 at Visit 1 and 6.41 at Visit 2, a 10.3% decrease. Both differences were highly statistically significant.
Pain Data
Among those reporting on pain symptoms with 3 or more visits and WS < 4 (14 participants), there was a 91.6% increase in WS and a 6.2% decrease in SS. Among those with 3 or more visits and SS > 7 (58 participants), there was a 21.6% increase in WS and a 14.1% decrease in SS.
Fatigue Data
Among those reporting on fatigue with 2 or more visits and WS < 4 (24 participants), there was a 164.4% increase in WS and a 10.8% decrease in SS. Among those with 2 or more visits and SS > 7 (59 participants), there was a 12% increase in WS and a 18% decrease in SS.
While this data was self-reported and not collected with a research study in mind, and outside variables were not taken into account, the data provides strong evidence as to the wellness benefits experienced by significant numbers of clients, especially those with the greatest need.
Comparing NES Scan Results with Self-Reported Concerns
We analyzed 5118 scans to determine how directly our bioenergetic assessment correlated with primary client health concerns. Our scan does not make a direct physical diagnosis. We were only looking for bioenergetic correlations.
Prior to each scan, we asked the client to choose the Body System s/he was most concerned with. We looked at the 3 Energetic Drivers and 3 Energetic Integrators (more in the case of ties) that most frequently showed up as a top priority for each Body System. We should note:
- Our scan does not determine severity, nor whether something is acute or chronic. Scan priorities may indicate support needed for something not related to known and/or long-term concerns.
- The body-field is holographic in nature, so every Driver and Integrator has a degree of relevance to any concern. What’s more, the body-field may seek a non-linear approach to assisting a known concern.
- The client may have been concerned about many body systems.
All of these points provide reasons why unexpected priorities – from a symptomatic perspective – could show up. In spite of this, scan results showed many strong correlations to primary client health concerns. Below are some highlights. A more detailed report is available.
Cardiovascular System (n = 917 scans)
This was the most common concern among participants. 11 of our 28 Drivers and Integrators have direct bioenergetic correlations to this system, so by chance alone, 1 Driver and 1-2 Integrators among these 11 would be among our 6 priorities. Instead, all 6 priorities had direct correlation to this system.
Muscular System (n = 365 scans)
Besides the obvious correlation of Muscle Driver, which did not show up as a priority, all other direct correlations would involve energy production and nutrient delivery (i.e., anything related to circulation, from blood cell production to blood pressure to blood filtering, etc.). All of our top priorities fell into these two categories.
Skeletal System (n = 275 scans)
At a glance, the strongest correlations here would be anything involving bones and calcium metabolism. But bone marrow produces blood cells, which creates an intimate link between bones and the cardiovascular system (which also depends on calcium metabolism for the heart’s contraction and blood vessel dilation by the nerves). 4 of our top priorities related to blood and circulation, in addition to another (Kidney Driver) associated with blood filtering.
What’s more, NES research confirms a traditional Chinese medicine (TCM) link between the bones and digestion, tying our final top priority (Stomach Driver) to this system as well.
Lymphatic System (n = 117 scans)
The most obviously expected Drivers / Integrators would be Spleen Driver and Meridian, as the spleen is the primary lymphatic organ; both were top priorities. Other highly expected priorities include Immunity Driver and the Bone Marrow Integrator, both bioenergetically linked to the production of white blood cells. Both of these also appeared among top priorities. Thus, of the 6 most highly expected scan items out of 28 possible scan items, 4 appeared as top priorities. By chance alone, only 1-2 would have appeared. In addition, the Neurotransmitter Integrator was a top priority, and neurotransmitters are immune system modulators.
Urinary System (n = 50 scans)
There are only 3 direct or obvious bioenergetic correlations between our Drivers and Integrators and the urinary system, so by chance alone, either zero or one would show up as top priorities. In fact, two of them did: Kidney Driver and Kidney Integrator. After this, correlations to the nervous system would also make sense, and both the Neurosensory and Neurotransmitter Integrators were top priorities.
* * * * *
As you can see, our early data is compelling, showing correlations between bioenergetic assessments and people’s known health concerns.